
Author: Ben Murrey
Introduction
Iowa enacted legislation in 2022 to put the state on track for a single flat individual income tax rate of 3.9% by 2026. The tax change also created a mechanism to ratchet down the corporate income tax rates to a flat 5.5% rate over time as certain revenue conditions trigger rate buydowns. Under the reforms enacted from 2018 through 2022, Iowa reduced its individual income tax brackets from nine brackets with a top rate of 8.98% to three with a top rate of 5.7% in the current tax year. At the start of the 2024 legislative session, Iowa remained on track for two brackets with a top rate of 4.82% in 2025 and a flat rate of 3.9% starting in 2026. These changes set the state up to move from one of the top 10 most burdensome states for individual income tax in 2018 to one of the 10 least burdensome by 2026.[i] With strong budget surpluses expected to continue, the legislature and the governor passed legislation this year to expedite the individual income tax rate reductions and lower the target rate again.
With the passage of Senate File 2442 in April 2024, the state will move to a single flat individual income tax rate of 3.8% starting in tax year 2025. This report first provides historic background on income tax policy in Iowa. It describes the conditions that have made it possible to cut income taxes without impacting the state budget and why tax policy matters. It discusses the tax savings for individual taxpayers. It outlines the direct or “static” revenue impacts of the individual income tax changes on state and local revenues provided by Iowa’s Legislative Services Agency (LSA). Then, starting from that static impact, it models the indirect or “dynamic” economic and revenue impacts using the REMI Tax-PI model. Finally, it forecasts three state revenue and spending scenarios to evaluate the sustainability of recent tax reductions and whether lawmakers can reduce taxes further without state budget cuts.
Key Findings
- Common Sense Institute’s dynamic economic simulation forecasts that over 10 years the SF 2442 income tax rate reductions will result in—
- $1.85 billion in tax savings for income-tax payers.
- a $3 billion increase in after-tax income across the entire economy.
- $1.72 billion in GDP growth.
- approximately 6,800 new jobs created in 2025.
- The economic stimulus resulting from SF 2442 cutting individual income taxes will offset $120 million of the revenue loss to the state over the first 10 years.
- In three forecasted scenarios, including two recessions of varying severity, CSI found Iowa’s recent tax reductions are sustainable over the long term.
- In all three forecasted scenarios, including a recession comparable to 2008, CSI found Iowa could sustain additional tax reductions without reducing state spending over at least the next decade if it did so judiciously.
- In 2025, SF 2442 will reduce income taxes for the typical Iowa household earning $75,000 per year by approximately $410, in addition to savings from recent reforms.
- The typical household will see a reduction in their effective tax rate from 4.71% to 3.8% for 2025 and a reduction from 3.9% to 3.8% in future years.
Background
States began adopting income taxes in the early 20th century. A third of states, including Iowa, adopted an income tax in the 1930s.[ii] Today, only seven states levy no taxes on personal income.[iii] In addition, Washington and New Hampshire exempt most income from tax. Iowa—along with most other income tax states—adopted a progressive tax structure, leaving only 12 states with a flat tax today. In 2025, Iowa will become the 13th flat tax state and the 10th state ever to migrate from a progressive rate structure to a single flat individual income tax rate.[iv]
The structure of Iowa’s individual income tax has evolved since 1934. When first adopted, the tax was comprised of five brackets with rates ranging from 1% to 5%. In the 1960s, lawmakers added two additional brackets. The brackets became most numerous and levied at the highest rates in the following decade. From 1975 to 1987, Iowa maintained 13 individual income tax brackets with a top rate of 13%. In 1987, lawmakers adopted the basic individual income tax structure that existed until the 2018 through 2024 reforms.
In recent years, lawmakers have worked to advance an income tax reform agenda aimed at lowering the overall income tax burden and moving to a single flat rate. In 2018, the legislature passed and the governor signed SF 2417. Among other policy changes, the bill lowered rates across all nine brackets, reducing the top rate to 8.53%. In 2022, HF 2317 implemented a phase down of the nine brackets to just one 3.9% rate for all taxpayers starting in 2026. Legislation passed this year—the focus of this report—will amend the previous plan by implementing a flat rate of 3.8% starting in tax year 2025.[v] Some lawmakers have proposed phasing out Iowa’s individual income tax entirely.[vi]
| Table 1. Iowa Individual Income Tax History | |
| Effective Tax Year | Rates and Income Tax Brackets |
| 1934 | Graduated rates imposed ranging from 1.0% to 5.0% over 5 taxable income brackets with a top bracket of $4,000 |
| 1953 | Rates lowered to range from 0.75% to 3.75% over 5 taxable income brackets with top bracket raised to $5,000 |
| 1955 | Rates increased to range from 0.8% to 4.0% over 5 taxable income brackets with the top bracket lowered to $4,000 |
| 1957 | Rates lowered to range from 0.75% to 3.75% over the same taxable income brackets |
| 1965 | Rate changed to range from 0.75% to 4.5% over 6 taxable income brackets with the top bracket of $9,000 |
| 1967 | Additional bracket and new top 5.25% rate introduced. |
| 1971 | Rates increased on all brackets except lowest two, rates ranging from 0.75% to 7.0% |
| 1975 | Rates ranging from 0.5% to 13.0% over 13 taxable income brackets with the top bracket of $75,000 |
| 1979 | One-time indexation of brackets, raising top bracket to $76,725 |
| 1987 | Rates changed to 0.4% to 9.98% over 9 taxable income brackets with the top bracket of $45,000 |
| 1996 | Annual indexation of brackets instituted |
| 1998 | All tax rates cut 10% with a range of 0.36% through 8.98% over 9 taxable income brackets with the top bracket of $45,000 indexed ($51,660) |
| 2019 | All tax rates cut with a range of 0.33% through 8.53% over 9 taxable income brackets with a top bracket of $73,710 (indexed annually) |
| Source: Iowa Department of Revenue | |
Why It Matters
Since the start of the COVID-19 pandemic, the United States federal government and the Federal Reserve Bank of the United States have injected trillions of dollars in fiscal and monetary stimulus into the economy.[vii] Their actions increased the U.S. dollar M2 money supply by about 40% in just 2 years.[viii] While increasing the money supply funded the stimulus that helped bridge the gap for many Iowa families and businesses during economic shutdowns of 2020 and 2021, consumers are now paying the price for it.
A year after pandemic stimulus measures went into effect, the annual rate of inflation began to accelerate. By June 2022, year-over-year inflation hit a 4-decade high of 9.1%.[ix] While inflation has since cooled, it remains well above the historic norm and the Fed’s target rate of 2%.[x] Put simply, higher prices are here to stay, and prices continue to rise at nearly double the average inflation rate from the decade preceding the pandemic. Consumer prices in Iowa have risen by over 20% in the four years since Congress passed the CARES Act.[xi] As a result, the typical Iowa household needs $1,000 more per month to maintain the same standard of living.[xii] Wages have failed to keep up.[xiii] Meanwhile, the same federal stimulus that sent prices rising faster than Iowans’ wages also boosted tax receipts across the country.
Between 2019 and 2023, cumulative state and local tax revenues in the United States have increased by 28%, outpacing the cumulative inflation of about 19% over the same period.[xiv] In Colorado, general fund revenues increased 44% from FY 2019-20 to FY 2023-24.[xv] In California, general fund revenues rose 40%.[xvi] Iowa saw a 30% increase in general fund revenue over the period. But exactly how policymakers in each state respond to these increases in revenues can significantly impact their state’s economic competitiveness and their residents’ livelihood and standard of living.
While California’s general fund revenue increased a handsome 40% from FY 2019-20 to FY 2023-24, its expenditures increased by 58%.[xvii] Despite bloated public spending, the Golden State has one of the highest levels of economic inequality in the country.[xviii] It also saw the number of Californians living at or near the poverty level rise from 28.7% in 2021 to 31.1% in 2023.[xix] It now faces a budget deficit of up to $73 billion, forcing large budget cuts.[xx] Meanwhile, over 400,000 residents left the state on net between July 2021 and July 2022, migrating primarily to Texas and Arizona.[xxi] The former has no income tax. Starting with tax year 2023, Arizona consolidated its multi-bracket individual income tax system into a single low rate of 2.5%, making it the lowest of any state that levies an income tax.[xxii] Iowa is taking the same path.
Figure 1 shows actual and forecasted annual general fund revenue, appropriations, the annual balance of the state surplus, and the balance of the Taxpayer Relief Fund (TRF) for FY 2017-18 through FY 2025-26 prior to the passage of SF 2442. Rather than increasing its spending by 30% when revenues surged 30%, Iowa lawmakers have budgeted and spent far less than statutorily allowed since 2021.[xxiii] This gap between annual appropriations and revenues created a surplus, illustrated in figure 1 in the gap that emerges between the red and yellow lines starting in 2021. Lawmakers used the surplus to max out the state’s rainy-day reserve funds. Then, they put aside over $3.7 billion in a Taxpayer Reserve Fund to support tax cuts while continuing to roll additional surplus dollars forward each year, represented by the blue and green lines in figure 1.[xxiv] These measures provide the revenue and budgetary basis for lowering Iowa’s income tax rates.
What it means for Taxpayers
The state’s fiscal restraint paired with reductions in individual income tax rates will bring meaningful tax savings to Iowa families and businesses. This section serves to demonstrate approximate tax savings for different income levels and filing statuses. Determining exact tax savings with the recent changes from SF 2442 will depend on each tax filer’s unique circumstances. Readers should consult with a professional tax advisor to determine how tax policy changes will affect them. Tables 2 and 3 shows the new income tax rates under “current law” prior to the passage of SF 2442 and the new rates after its passage.
Table 2. Income Tax Rates for Single Filers before and after SF 2442
Source: SF 2442 fiscal note, LSA
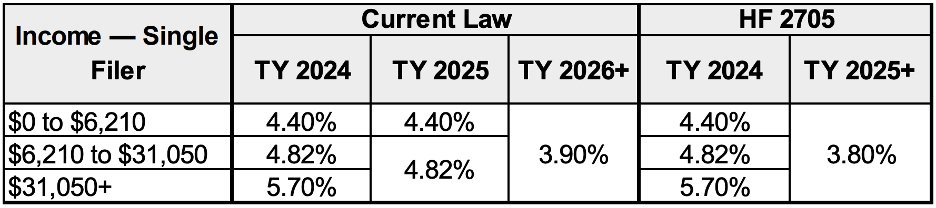
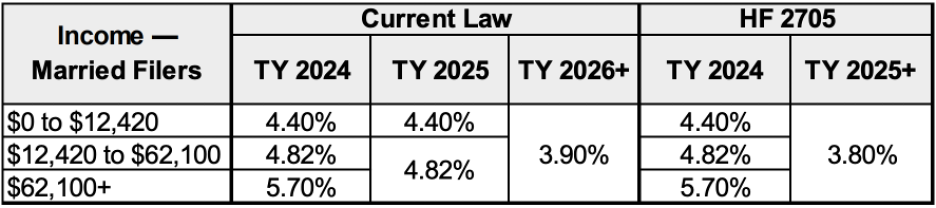
Table 3. Income Tax Rates for Joint Filers before and after SF 2442
Source: SF 2442 fiscal note, LSA
Tables 4 and 5 assume each taxpayer takes the standard deduction and claims no other deductions, exemptions, or credits. The 2024 standard deduction equals $14,600 for single filers and $29,200 for joint filers. The IRS has not yet announced the standard deduction amount for 2025, therefore the tables assume a $15,000 deduction for single filers and $30,000 for joint. Additionally, the state of Iowa did not announce the inflation adjustment for the two tax brackets for 2025 under previous law. For 2024, the 4.82% bracket starts at $6,211 for single filers and $12,421 dollars for joint filers.[xxv] The tables adjust those amounts to $12,501, and $6,251 for tax year 2025.
Table 4. Individual Income Tax Liability before and after SF 2442 – Tax Year 2025
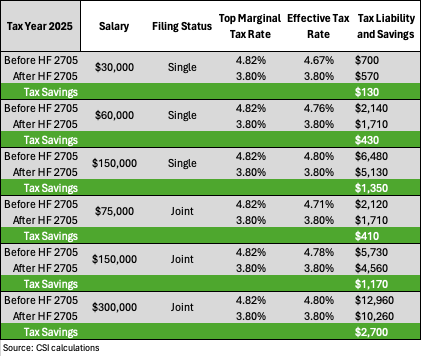
The baseline in Table 4 reflects current law prior to the passage of SF 2442 earlier this year. The difference does not show the tax savings from bills passed in 2022 (HF 2317), 2021 (SF 619), and 2018 (SF 2417). This year’s changes add to the total tax savings from reforms since 2018. This report analyzes the impacts of the individual income tax rate changes in SF 2442. For that reason, relatively little tax savings from personal income tax is seen after 2025, as seen in Table 5. House File 2317 from 2022 already created substantial tax savings for 2026 and beyond.
Table 5. Individual Income Tax Liability before and after SF 2442 – After 2025
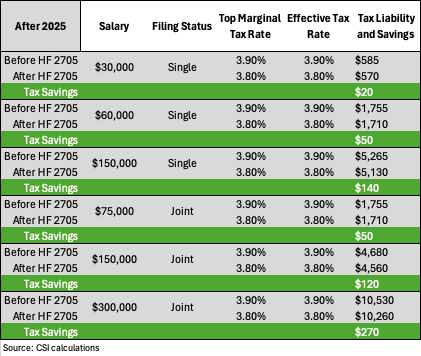
Most of the tax savings from cuts to individual income taxes came with previous reforms since 2018. The changes in SF 2442 will bring a significant amount of additional tax savings in 2025 and will reduce tax liability by a small amount in perpetuity every year after that. The same is true for the bill’s impact on state revenues. Thanks to recent reforms, Iowa will have a lower individual income tax rate than any of its neighbors except South Dakota, which has no individual income tax.[xxvi]
Static Impacts
Lowering individual income tax rates reduces state revenue. Iowa’s Legislative Services Agency estimates revenue impacts on a static basis; it does not consider secondary effects of policy changes on economic behavior and resulting changes in macroeconomic conditions such as GDP growth and job creation. On a static basis, LSA estimates the reduction in personal income tax rates in SF 2442 will reduce state revenues by $328.2 million in FY 2024-25 (half year impact for tax year 2025) and $605.3 million in FY 2025-26. Because LSA based its forecast on current law prior to the passage of SF 2442—which incorporated previous tax reform measures in 2018 and 2022 that would have fully implemented a flat personal income tax rate of 3.9% starting in 2026—most of the revenue impact shows up in tax year 2025. From tax year 2026 on, SF 2442 simply reduces Iowa’s flat individual income tax rate from 3.9% to 3.8%. Thus, the static revenue impact falls from a $605 million revenue reduction in FY 2025-26 to a $97 million reduction in FY 2026-27. Table 6 shows the LSA projection of the static impact of SF 2442’s individual income tax reductions on state revenue. This revenue impact also represents direct income tax savings from the tax cut.
Table 6. Static State Government Revenue Impact of Individual Income Tax Rate Changes in SF 2442
| (millions of dollars) | FY 2025 | FY 2026 | FY 2027 | FY 2028 | FY 2029 | FY 2030 |
| State Revenue Change | -328.2 | -605.3 | -97.0 | -96.8 | -99.5 | -102.4 |
Source: SF 2442 fiscal note, LSA
The bill also reduces local tax revenues due to an incidental reduction in school district income surtaxes. Table 7 shows the static impact of SF 2442’s individual income tax cuts on local revenues.
Table 7. Static Local Government Revenue Impact of Individual Income Tax Rate Changes in SF 2442
| (millions of dollars) | FY 2025 | FY 2026 | FY 2027 | FY 2028 | FY 2029 | FY 2030 |
| State Revenue Change | -8.1 | -15.0 | -2.4 | -2.4 | -2.5 | -2.5 |
Source: SF 2442 fiscal note, LSA
Dynamic Impacts
Starting with LSA’s static impact, the Common Sense Institute simulated the dynamic impacts of the individual income tax rate reductions in SF 2442 on Iowa’s economy and state tax revenues over 10 years using the REMI Tax-PI model. As with any economic forecast, CSI’s economic and revenue model makes certain assumptions. Those assumptions produce the necessary inputs for the tax model and thus affect the outputs.
First, LSA does not anticipate the income tax cuts in SF 2442 will have any impact on state spending through FY 2029. If the tax cut does trigger a budget shortfall, however, the bill allows the state to use the $3.74 billion in the TRF to offset the revenue loss from the income tax rate reduction, preventing state budget cuts. The CSI simulation therefore assumes no reduction in state spending. It does assume a reduction in local spending equal to the tax savings from the incidental decrease in school district income surtaxes shown in Table 7. Because the model assumes no reduction in state spending, it treats the entire static state revenue reduction as a direct stimulus to the economy. It must also consider how that money will enter and make its way through the economy. Because LSA does not provide a revenue impact after FY 2030, CSI’s model also projects the static revenue impact from FY 2031 through FY 2034.
Common Sense Institute’s simulation estimates the static revenue impact of the tax cuts to grow at a rate of 4% annually from FY 2031 through FY 2034. Historically, state revenues have grown at just over 4% annually on average. The revenue reduction (and direct tax savings) for the out years (after FY 2030) results from a constant 0.1% reduction in the tax rate. The model therefore assumes the annual direct tax savings will grow at the same constant 4% annual rate as state revenues. The final assumption considers how the money from the tax reduction will work its way through the economy.
Employees and businesses pay individual income taxes, and each may behave differently with the increased earnings resulting from a tax cut. The CSI simulation assumes when employees receive higher wages or salaries, their personal consumption increases. Empirical evidence shows that when businesses receive new income from a tax cut, they reinvest it.[xxvii] The simulation assumes pass-through businesses behave the same way. Thus, it treats the share of the income tax reduction that will increase business income as a reduction in business production costs. The amount of individual income tax revenue attributable to employees versus businesses is derived from REMI tax data. The economic impacts in table 8 are shown in calendar years.
Table 8. Economic Impacts: Individual Income Tax Rate Reductions in SF 2442
| Table 8. | |||||||||||
| (dollars in millions) | 2025 | 2026 | 2027 | 2028 | 2029 | 2030 | 2031 | 2032 | 2033 | 2034 | 10-Year |
| Direct Income Tax Savings | $895.2 | $92.8 | $95.4 | $98.1 | $101.0 | $103.9 | $108.0 | $112.4 | $116.8 | $121.5 | $1,845.2 |
| Total Growth in After-tax Income | $1,239.7 | $278.8 | $237.3 | $203.7 | $181.1 | $168.4 | $164.9 | $167.8 | $174.8 | $184.6 | $3,001.1 |
| Change in Gross Domestic Product | $746.0 | $251.0 | $179.8 | $120.4 | $83.8 | $64.8 | $59.3 | $62.4 | $70.5 | $81.3 | $1,719.4 |
| Change in Total Employment | 7,300 | 2,300 | 1,600 | 1,100 | 700 | 600 | 500 | 500 | 500 | 600 |
In table 8, “Direct Income Tax Savings” equals the total static or direct reduction in personal income taxes from SF 2442 based on Iowa Department of Revenue (IDR) data. All other rows quantify the indirect or secondary economic impacts the model anticipates will result from that tax cut. “Total Growth in After-tax Income,” also called “disposable personal income,” represents the cumulative increase in after-tax income for all Iowans. This demonstrates the benefits taxpayers will see across the entire Iowa economy, regardless of whether they pay income taxes. The reduction in taxes also generates economic activity that leads to employment and GDP growth, as shown in the last two rows of table 8. “Change in Total Employment” is annual, not cumulative.
Reducing tax rates reduces state revenue on a static basis by an amount directly proportional to the change in the rate. However, lowering taxes can change economic behavior in a way that boosts state revenues. For example, an individual who saved $400 in taxes may spend that money in the state’s economy, increasing sales tax receipts. Likewise, a business might use tax savings to expand production, thus creating jobs and increasing gross state product, which in turn could increase income tax revenue. Thus, the actual revenue reduction from an income tax cut after accounting for dynamic effects comes out to less than the static impact.
Table 9 shows the static versus dynamic impact of the individual income tax rate reductions from SF 2442. The change shown in table 9 as “Revenue Change (Static)” represents the same direct tax revenue impact as the row “Direct Income Tax Savings” in table 8. Table 9 shows this impact by state fiscal year whereas table 8 shows it by tax year.
Table 9. Revenue Impacts: Individual Income Tax Rate Reductions in SF 2442
| Table 9. | |||||||||||
| (dollars in millions) | FY2025 | FY2026 | FY2027 | FY2028 | FY2029 | FY2030 | FY2031 | FY2032 | FY2033 | FY2034 | 10-Year |
| Revenue Change (Static) | -$328.2 | -$605.3 | -$97.0 | -$96.8 | -$99.5 | -$102.4 | -$106.5 | -$110.8 | -$115.2 | -$119.8 | -$1,781.4 |
| Revenue Change (Dynamic) | -$281.0 | -$593.4 | -$86.3 | -$88.1 | -$92.1 | -$95.7 | -$100.0 | -$104.2 | -$108.3 | -$112.4 | -$1,661.6 |
| Difference | $47.2 | $11.9 | $10.7 | $8.7 | $7.4 | $6.7 | $6.5 | $6.6 | $6.9 | $7.4 | $119.8 |
The tax savings to Iowa taxpayers represents a revenue loss of the same amount to the state on a static basis. However, reducing income taxes has secondary economic effects that result in an increase in sales, income, and other state tax revenues of a lesser amount. The row “Difference” represents the increase in state revenue due to these secondary effects; the row “Revenue Change (Dynamic)” equals the net reduction in state revenues after accounting for this revenue increase. The economic stimulus resulting from cutting individual income taxes offsets $120 million of the revenue loss over the first 10 years.
Impact on the State Budget
If not done responsibly, reducing tax rates can lead to a state budget shortfall. With the passage of SF 2442, some lawmakers and the governor have expressed interest in additional tax cuts while others have shown concern that even the current tax cuts are unsustainable.[xxviii] In addition to modeling the dynamic economic and revenue impacts of the income tax rate reductions, CSI forecasted three possible scenarios to help lawmakers and the public determine the sustainability of recent tax cuts and the viability of future ones. This section presents the three scenarios—one based on the assumptions from the dynamic model in the previous section, “Dynamic Impacts – SF 2442 Income Tax Rate Reductions,” and the others based on a mild and severe recession.
State fiscal analysts have assessed that the current tax cuts are sustainable at least through FY 2029 without the need for transfers from the TRF to the general fund. The fiscal note for a previous draft of the bill, HF 2705, says, “Under current law and assumptions, revenues are not estimated to fall below appropriations through FY 2029.”[xxix] Although this note did not make it into the final fiscal note for SF 2442, nothing changed substantively in the policy that would alter this assessment. If revenues were to fall below appropriations due to the tax cuts, the law permits the state to make up the difference with the previous years’ surpluses carried forward or by transferring TRF funds to the state’s general fund. State forecasters currently anticipate a $2.4 billion surplus in FY 2025.[xxx] The TRF balance currently sits at $3.74 million, as shown in figure 1.[xxxi]
To test the legislature’s assessment, Common Sense Institute forecasted the bill’s impact on state revenues relative to appropriations over the next ten years based on three hypothetical scenarios. The forecasts do not account for other tax policy changes in SF 2442 or other legislation passed in 2024. The baseline—labeled in figures 3, 4, and 5 with “before SF 2442”—represents the March 2023 Revenue Estimating Conference (REC) figures and actual revenues and appropriations from previous years.[xxxii] Common Sense Institute’s simulation uses the REMI Tax-PI model to forecast the dynamic revenue impact of the 2024 income tax cuts for all three scenarios using the same underlying assumptions described under “Dynamic Impacts – SF 2442 Income Tax Rate Reductions,” except each scenario modifies assumptions about the annual change in revenue. They each assume a direct inverse relationship between the change in overall revenue and the amount of revenue lost from the tax cuts. For example, the first scenario assumes state revenue will increase by 4% from FY 2030 to FY 2031; therefore, it also assumes state revenues will fall by 4% more in FY 2031 because of the tax cut than it did in FY 2030. All scenarios assume appropriations grow at the approximate historic average rate of 3% annually after FY 2025.
Rather than using the static impacts provided by LSA in the fiscal note, all three scenarios use unique dynamic revenue impacts from CSI’s REMI modeling to calculate net general fund revenue after the 2024 income tax cuts. Table 9 shows the static and dynamic revenue impacts for scenario 1 (shown in figure 3). These reflect the estimates and assumptions used in CSI’s economic model under the section of this report entitled “Dynamic Impacts – SF 2442 Income Tax Rate Reductions.” The revenue reductions change slightly in the model for scenarios 2 and 3 (figures 4 and 5) based on the change in overall revenues in each scenario.
The results in tables 8 and 9 show the dynamic impact of the individual income tax cuts in SF 2442 relative to the counterfactual. (The counterfactual equals current law prior to the passage of SF 2442.) For that reason, the results of the model would not change significantly if the economy were to grow at a faster or slower pace than assumed in the model due to externalities unrelated to the tax cut itself. However, the state of the economy could significantly impact state revenues regardless of the individual income tax cuts. This section of the report forecasts whether this year’s income tax rate reductions would cause a revenue shortfall where it would not occur otherwise.
As a point of reference for the three scenarios forecasted in this section, figure 2 shows actual historic data and future estimates by LSA and the REC. The amounts are identical to figure 1 with the addition of gross general fund revenue. “Gross GF Revenue” represents what state budget documents call “receipts” or “gross tax & other receipts.” “Net Revenue” equals tax receipts after transfers, refunds, and accruals and represents what state budget documents call “net receipts plus transfers.” For figures 2 through 5, solid lines equal actuals and dotted lines represent projections, whether by LSA, the REC, or CSI.
The first scenario, depicted in figure 3, makes the same assumptions as the economic model from the previous section of this report, “Dynamic Impacts – SF 2442 Income Tax Rate Reductions.” It uses historic trends to forecast revenues, appropriations, and the cost of the tax cut beyond the forecast window provided by the state.
Scenario 1
In the 10-year period from FY 2014 to FY 2023, Iowa’s gross state revenues grew by an average of 3.97% and its net revenue grew by 3.89%. In the 20-year period from FY 2004 to FY 2023, they grew by an average of 4.29% and 4.11%. The averages of each period’s average growth rate are 4.13% and 4%. Economic conditions in the state are the main determinant of state revenues, though tax policy changes at the state and federal level also impacted state revenues during these periods. Scenario 1 adopts the net general fund revenue forecast by the REC through FY 2026 and gross general fund revenue through FY 2025, as REC does not provide an FY 2026 gross revenue estimate. For the revenue impact from the income tax rate cuts, it adopts the fiscal impact provided in the fiscal note for SF 2442 through FY 2030. To produce a full 10-year forecast, revenues and the cost of the tax cuts grow by 4% annually through FY 2034 for every year in which the state does not provide a forecast.
Figure 3 makes immediately evident that the largest impact of the income tax cuts in SF 2442 relative to the counterfactual comes in fiscal years 2025 and 2026. In scenario 1, net general fund revenues would fall $168 million short of appropriations in FY 2026. Revenues would then surpass appropriations for the rest of the 10-year period resulting in a $7.52 billion surplus over 10 years after the tax cuts. Had SF 2442 not become law, net general fund revenues would not fall below appropriations any year in the 10-year forecast. However, the FY 2026 revenue shortfall resulting from the individual income tax cuts would require neither budget cuts nor transfers from the TRF. The state currently anticipates a $2.4 billion surplus balance at the end of FY 2025 that could easily make up the shortfall from FY 2026 tax receipts.[xxxiii] Under scenario 1, SF 2442 would not require budget cuts or withdrawals from the TRF over the next 10 years.
Scenario 1 presents an outlook based on conservative assumptions. The projection begins with the REC’s revenue estimates, which show the state’s net general fund revenue declining by 2.22% in FY 2024, increasing by just 0.74% in FY 2025, and then declining again by 1% in FY 2026 before returning to average annual revenue growth. This scenario results in a $7.52 billion surplus over 10 years after accounting for the SF 2442 income tax cuts. Under this scenario, the state could enact additional tax relief for individuals and businesses without cutting the budget or reducing the rate of growth in spending below the historic average. While the governor and state lawmakers hope ultimately to phase out Iowa’s income tax, state budgeters have been wary to cut taxes too aggressively out of concern over budget shortfalls and possible recession.[xxxiv] The next two scenarios consider the possible impact of a mild and more severe recession on Iowa state revenues.
Scenario 2
Assuming the current REC forecast proves accurate, it would be anomalous to see multiple years of major revenue declines after the forecasted 1% decline in FY 2026. Even during the 2008 recession, Iowa experienced only two years of revenue declines. The three years before and after those declines saw above average revenue growth. If Iowa is currently in a recession, however, REC’s FY 2026 estimate may not prove conservative enough. When the recession hit in December of 2007, economists did not declare a recession until a year later in December of 2008. Iowa’s net general fund revenues had grown by 9.2% in FY 2006, 4.9% in FY 2007, and 7.8% in FY 2008. The recession that began in December 2007 triggered a 2.5% revenue decline in FY 2009 and a 5% decline in FY 2010. Revenues recovered sharply over the next three years with 4.7%, 7% and 7.5% annual growth.
Scenario 2 supposes a mild recession began in late 2023, which the public will learn about later this year, just as the 2008 recession officially began in December 2007 and was announced in December 2009. The scenario supposes the 2024 recession causes 2 years of recession-induced revenue declines starting in FY 2025, just as the 2008 recession triggered revenue declines starting in FY 2009. Notably, this scenario also assumes the 2.22% decline in revenue currently forecasted by the REC. Notably, a recession did not cause the FY 2024 negative revenue growth. If not for the 2022 income tax cuts, revenues would have grown by approximately 2.65% in FY 2023 and 0.45% in FY 2024.[xxxv] The first year of recession-induced revenue declines start in FY 2025 in this scenario. It assumes revenues fall by 3% in both FY 2025 and FY 2026. In FY 2027 and FY 2028, revenues recover sharply with 5% and 6% gains. In this scenario, revenue growth after FY 2028 continues at 3%—below the long-term average of 4% seen in scenario 1. This is representative of the impact a mild recession followed by a “new normal” of slower economic growth might have on state revenues.
Despite revenue loss from recent tax cuts and additional declines starting in FY 2025 from the hypothetical recession, in scenario 2 revenues remain above appropriations in FY 2025 with or without the SF 2442 income tax cuts. With this year’s tax cuts, the scenario results in net general fund revenues coming in $156.5 million above appropriations in FY 2025. If a recession were to cause revenue decline in FY 2025 even slightly larger than the assumed 3% decline in scenario 2, it could result in a shortfall that year. In scenario 2, the state would experience a $118 million revenue shortfall due to the recession. When accounting for the revenue loss from this year’s income tax cuts, the state would experience a $678 million shortfall. In FY 2027, the state would experience a $26 million shortfall with the tax cut and a $60 surplus without it. Again, this assumes the most recent LSA appropriation estimate of $8.9 billion for FY 2025 and a constant 3% annual growth rate thereafter.[xxxvi] This mild recession scenario results in a $1.38 billion surplus over 10 years versus $7.52 billion in the no recession scenario.
Like scenario 1, the FY 2026 revenue shortfall in scenario 2 would require neither budget cuts nor transfers from the TRF. Lawmakers would have several options for bridging the gap between revenues and appropriations in FY 2026 and FY 2027. For example, slower rate of growth in appropriations for a couple of years could easily make up the difference. Alternatively, the legislature could transfer $704 billion from the state surplus to balance the budget. Based on current REC estimates, the state will end FY 2025 with a $2.4 billion surplus. Under scenario 2, it would end the year with a surplus of just over $2 billion—enough to cover the entire $704 million shortfall from the two recession years. Furthermore, in this scenario the revenue shortfall would be the result of a mild recession, arguably justifying a transfer from the state’s economic emergency reserve fund.
Given the state’s existing surplus, the $3.7 billion TRF balance expected at the end of FY 2024, and maxed-out emergency reserves, lawmakers could enact additional income tax reductions under scenario 2 without cutting the budget or reducing the rate of growth in spending below the historic average.
Scenario 3
The third scenario CSI forecasted assumes a major recession in 2025 and 2026. Like in the 2008 recession, it assumes the 2025 recession triggers a drop in revenue in the next fiscal year, FY 2026. For this scenario, gross and net general fund revenues for FY 2026 through FY 2034 exactly mirror FY 2009 (the first negative revenue year during the recession) through FY 2017 growth rates. In truth, this scenario would be more severe than the 2008 recession.
While the 2008 recession was preceded by three years of exceptional revenue growth, scenario 3 assumes low revenue growth in the two years preceding the hypothetical recession. The REC reports 0.43% revenue growth in FY 2023 and -2.22% in FY 2024.[xxxvii] As explained under scenario 2, the FY 2023 decline in revenue was induced by the 2022 tax cuts, not a recession. Even without the 2022 tax cuts, however, FY 2023 and FY 2024 revenue growth would greatly lag the growth seen in the two years preceding the 2008 recession. Therefore, scenario 3—illustrated in figure 5—represents a state revenue outlook worse than what Iowa experienced during the Great Recession.
Under this scenario, the state would see revenue shortfalls for most of the 10-year period with or without the income tax cuts promulgated in 2024. After the 2008 recession, Iowa experienced revenue declines in 2014, reflected in the FY 2031 revenue decline shown in figure 5. Because scenario 3 assumes a recession in 2025, impacting 2025 tax receipts, revenue declines do not begin until FY 2026. As a result, a budget surplus persists in FY 2025 with or without the SF 2442 tax cuts. The tax cuts make a difference in FY 2026. That year, scenario 3 yields a budget shortfall with this year’s tax cuts while maintaining a surplus without them. After two consecutive years of revenue declines, the state begins to experience shortfalls with or without the tax cuts for most of the remaining years. Nonetheless, the state budget remains secure in this scenario.
Over the 10-year forecast in scenario 3, cumulative net general fund revenues come in $1.57 billion below cumulative net appropriations. This again assumes the most recent LSA appropriations estimate of $8.9 billion for FY 2025 and a constant 3% annual growth rate thereafter. Nonetheless, lawmakers could safely maintain current income tax rates without cutting the state budget or transferring money to the general fund from the TRF. This scenario maintains REC’s assumption of a $2.4 billion surplus going into FY 2026 (see figure 2). That alone could bridge the gap between revenues and appropriations.
Additionally, because the shortfall in scenario 2 would be caused primarily by an economic recession rather than just tax cuts, lawmakers could justifiably tap into emergency reserve funds. “The balances in the State’s two reserve funds are projected to be at the statutory maximum for both FY 2024 and FY 2025,” according to LSA. “The combined balances are estimated at $961.9 million for FY 2024 and $963.7 million for FY 2025.”[xxxviii] The legislature could also respond to the recession by slowing the rate of growth in state spending. These actions or a combination thereof would allow the state to avoid budget cuts during the recession while leaving the TRF untouched. Under scenario 3, the state would not need to cut state spending or the rate of growth in state spending during the 10-year forecast or thereafter, assuming historic trends continue over the long term.
Under the severe recession scenario, lawmakers could also enact additional tax cuts without cutting state spending during the 10-year forecast period. However, in scenario 3 the sustainability of new tax cuts in the first 10 years would depend on depleting finite resources from the current surplus, the TRF, and potentially emergency funds. Those resources would get the state through the first ten years of this scenario without budget cuts; whether the tax cuts remain sustainable beyond the 10-year window depends on several factors, including the size of the tax cuts and future revenue growth.
If state revenues return to their historic growth rate of about 4% after the hypothetical recession in scenario 3, state revenues would begin to exceed appropriations again in the mid-to-late 2030s under current law. If legislators were to adopt additional tax cuts in a scenario 3 environment, it would take longer for revenues to catch up, depending on the size of the tax cut. If in this scenario lawmakers wanted to cut taxes without reducing the rate of growth in appropriations below 3% annually, they would need to ensure the cuts do not cause the TRF to run dry before revenue catches up. Naturally, if lawmakers increase the rate of growth in state spending or state revenue growth averages less than the historic norm over the next decade, revenues may never catch up. This could force budget cuts or other legislative action such as reducing or eliminating tax expenditures or increasing tax rates.
Conclusion
Since enacting the largest tax cuts in state history in 2022, Iowa has continued to experience budget surpluses. In 2024, lawmakers responded by keeping spending in check and returning more of the state’s persistent surpluses back to taxpayers. These tax cuts will create significant tax savings for Iowa families and businesses that continue to face inflationary pressures on their budgets. In addition to the $1.85 billion in direct income tax savings from these cuts, Iowans will benefit from indirect, dynamic economic effects of reducing the individual income tax rate. Using the REMI Tax-PI model, the Common Sense Institute found that over the next decade the additional income tax cuts promulgated this year will generate over $1.7 in GDP growth and thousands of new jobs, resulting in a $3 billion increase in after-tax income across the state’s economy. That means the tax cut will benefit both income-tax payers and those who pay no income tax.
Lawmakers have taken a measured and incremental approach to the recent tax reforms that make them sustainable over the long term. Forecasting three scenarios, including a mild and severe recession, CSI found that over at least the next decade, Iowa can maintain existing tax reforms without the need for budget cuts. Indeed, the state of Iowa could maintain its historic average 3% annual increase in spending under all three scenarios and adopt additional tax reductions if done thoughtfully. The new 3.8% individual income tax rate starting in tax year 2025 will put more money in the pockets of Iowa families and businesses over the long term, making Iowa a more attractive place to live and do business.
[i] Andrey Yushkov, “State Individual Income Tax Rates and Brackets, 2024,” Tax Foundation, February 20, 2024, https://taxfoundation.org/data/all/state/state-income-tax-rates-2024/.
[ii] Scott Drenkard, “When Did Your State Adopt Its Income Tax?,” Tax Foundation, June 10, 2014, https://taxfoundation.org/data/all/state/when-did-your-state-adopt-its-income-tax/.
[iii] Yushkov, https://taxfoundation.org/data/all/state/state-income-tax-rates-2024/.
[iv] Jared Walczak and Katherine Loughead, “The State Flat Tax Revolution: Where Things Stand Today,” Tax Foundation, February 15, 2024, https://taxfoundation.org/blog/flat-tax-state-income-tax-reform/#timeline.
[v] Senate File 2442, 90th General Assembly, State of Iowa (2024).
[vi] Tom Barton, “Iowa GOP lawmakers unveil proposal to gradually eliminate state income tax,” The Gazette, February 1, 2024, https://www.thegazette.com/state-government/iowa-gop-lawmakers-unveil-proposal-to-gradually-eliminate-state-income-tax/.
[vii] Committee for a Responsible Federal Government, “COVID Money Tracker,” https://www.covidmoneytracker.org/ (accessed May 20, 2024).
[viii] Board of Governors of the Federal Reserve System (US), “M2 [M2SL],” https://fred.stlouisfed.org/series/M2SL (accessed May 21, 2024).
[ix] U.S. Bureau of Labor Statistics, “Consumer prices up 9.1 percent over the year ended June 2022, largest increase in 40 years,” July 18, 2022, https://www.bls.gov/opub/ted/2022/consumer-prices-up-9-1-percent-over-the-year-ended-june-2022-largest-increase-in-40-years.htm.
[x] U.S. Bureau of Labor Statistics, “Consumer Price Index Summary,” Economic News Release, May 15, 2024, https://www.bls.gov/news.release/cpi.nr0.htm.
[xi] U.S. Bureau of Labor Statistics, “Consumer Price Index – CPI,” under https://www.bls.gov/data/.
[xii] Ben Murrey, “Inflation in the Midwest March 2024,” Common Sense Institute, April 10, 2024, https://commonsenseinstituteia.org/inflation-in-the-midwest-march-2024/.
[xiii] Ben Murrey, “Prices in the 21st Century – Iowa,” Common Sense Institute, February 15, 2024, https://commonsenseinstituteia.org/prices-in-the-21st-century-iowa/.
[xiv] U.S. Census Bureau, Quarterly Summary of State & Local Tax Revenue Data Tools & Apps,” https://www.census.gov/programs-surveys/qtax/data/data-tools.html; U.S. Bureau of Labor Statistics, “Consumer Price Index – CPI”.
[xv] Colorado General Assembly, Economic & Revenue Forecast: March 2021, Legislative Council Staff, March 19, 2021, https://leg.colorado.gov/sites/default/files/images/marforecast_0.pdf; Colorado General Assembly, Economic & Revenue Forecast: March 2024, Legislative Council Staff, https://leg.colorado.gov/sites/default/files/images/mar2024forecastforposting_0.pdf.
[xvi] California Department of Finance, “General Fund Budget Summary,” January 2024, https://dof.ca.gov/wp-content/uploads/sites/352/2023/03/CHART-A.pdf.
[xvii] California Department of Finance, https://dof.ca.gov/wp-content/uploads/sites/352/2023/03/CHART-A.pdf.
[xviii] U.S. Census Bureau, “GINI Index of Income Inequality,” 2022.
[xix] Sarah Bohn et al., “Poverty in California,” Public Policy Institute of California, October 2023, https://www.ppic.org/publication/poverty-in-california/.
[xx] Adam Beam, “California lawmakers vote to reduce deficit by $17 billion, but harder choices lie ahead,” Associated Press, April 11, 2024, https://apnews.com/article/california-budget-deficit-gavin-newsom-09507c2b312e454baa50d38c94218a1d.
[xxi] Institute for Economic Policy Research, “California’s population drain,” https://siepr.stanford.edu/publications/policy-brief/californias-population-drain.
[xxii] Common Sense Institute, “Arizona’s New Tax Structure,” https://commonsenseinstituteaz.org/arizonas-new-tax-structure/.
[xxiii] Iowa General Assembly, Revenue Estimating Conference, March 15, 2024, https://www.legis.iowa.gov/docs/publications/QR/1448070.pdf.
[xxiv] Iowa General Assembly, State of Iowa: Projected Condition of the General Fund, Legislative Services Agency, 5, https://www.legis.iowa.gov/docs/publications/EOS/1449700.pdf.
[xxv] Iowa Department of Revenue, “IDR Announces 2024 Individual Income Tax Brackets and Interest Rates,” Press Release, October 25, 2023, https://tax.iowa.gov/idr-announces-2024-individual-income-tax-brackets-and-interest-rates.
[xxvi] Jared Walczak, Facts & Figures 2024: How Does Your State Compare?,” Tax Foundation, see Table 11, https://taxfoundation.org/wp-content/uploads/2024/04/Facts-and-Figures-How-Does-Your-State-Compare-Tax-Foundation-2.pdf.
[xxvii] Xavier Giroud and Joshua Rauh, “State Taxation and the Reallocation of Business Activity: Evidence from Establishment-Level Data,” abstract, University of Chicago Press, Journal of Political Economy 127, no. 3 (December 2017): 28-29; Gabriel Chodorow-Reich et al., “Tax Policy and Investment in a Global Economy,” National Bureau of Economic Research, Working Paper 32180 (March 2024), https://conference.nber.org/conf_papers/f191672.pdf. “For domestic-only firms plotted in Panel A, this composite tax term exactly comports with economic theory. The tight upward slope reveals a positive investment elasticity to taxation around TCJA.”
[xxviii] Robin Opsahl, “Gov. Kim Reynolds signs law lowering individual income tax rate to 3.8% in 2025,” Iowa Capital Dispatch, https://iowacapitaldispatch.com/2024/05/01/gov-kim-reynolds-signs-law-lowering-individual-income-tax-rate-to-3-8-in-2025/.
[xxix] Iowa General Assembly, Fiscal Note: HF 2705, by Jennifer Acton, Legislative Services Agency (April 19, 2024), 11, https://www.legis.iowa.gov/docs/publications/FN/1449532.pdf.
[xxx] https://www.legis.iowa.gov/docs/publications/EOS/1449700.pdf.
[xxxi] Projected Condition of the General Fund, 5, https://www.legis.iowa.gov/docs/publications/EOS/1449700.pdf.
[xxxii] Revenue Estimating Conference, March 15, 2024, https://www.legis.iowa.gov/docs/publications/QR/1448070.pdf.
[xxxiii] Projected Condition of the General Fund, 5, https://www.legis.iowa.gov/docs/publications/EOS/1449700.pdf.
[xxxiv] Iowa PBS, “Tax Policy and the 2024 Legislative Session,” March 22, 2024, https://www.iowapbs.org/shows/iowapress/iowa-press/episode/10971/tax-policy-and-2024-legislative-session.
[xxxv] Iowa General Assembly, Fiscal Note: HF 2317, by Holly M. Lyons, Legislative Services Agency (June 23, 2022), 5, https://www.legis.iowa.gov/docs/publications/FN/1292087.pdf. The fiscal note for HF 2317 shows individual income tax cuts reducing revenues by $216.7 million in FY 2023 and $482 million in FY 2024. Without that policy change, revenues would be estimated at $10.063 billion for FY 202s and $10.109 billion for FY 2024 rather than current estimate of $9.845 billion and $9.627 billion after the 2022 income tax cuts.
[xxxvi] Projected Condition of the General Fund, https://www.legis.iowa.gov/docs/publications/EOS/1449700.pdf.
[xxxvii] Revenue Estimating Conference, March 15, 2024, https://www.legis.iowa.gov/docs/publications/QR/1448070.pdf.
[xxxviii] Iowa General Assembly, LSA General Fund Balance Sheet Update (March 2024), Legislative Services Agency, Fiscal Update Article (March 19, 2024), 3, https://www.legis.iowa.gov/docs/publications/BL/1448056.pdf.