
Author: Steven L. Byers, P.h.D., Ben Murrey
Introduction
Earlier this month, U.S. News & World Report ranked Iowa the sixth-best state in the United States based on an index that ranks all 50 states using 71 metrics across eight categories. Similarly, Common Sense Institute issues a Free Enterprise Report annually that ranks each state’s competitiveness relative to the 49 other states and the District of Columbia through a free-enterprise lens. Because public safety is crucial to a state’s ability to attract newcomers, keep existing residents, bring in new businesses, and expand those already located in the state, both the CSI and U.S. News & World Report indexes include metrics related to public safety. They point to similar conclusions: Iowa is one of the best if not the best state for public safety. This report investigates in detail Iowa’s results for the five metrics that make up the public safety category of CSI’s Free Enterprise Report.
Key Findings
- Based on the CSI Public Safety Competitiveness Index, Iowa ranks #1 nationally for public safety outcomes (crime rates, overdose deaths, and homelessness).
- According to CSI’s Public Safety Competitiveness Index, Iowa has the third-fewest drug overdose deaths per capita, sixth-lowest rate of homelessness, and 14th-lowest overall crime rate.
- Iowa ranks near the bottom nationally for “police per capita” and “public safety spending per capita.”
- Iowa achieves some of the best public safety outcomes nationally despite spending third least per capita on public safety and maintaining fewer police per capita than most states.
- Because Iowa spends relatively little on public safety and police, it scores 77 in the overall index, making it just 14th best in the overall index.
State Public Safety Competitiveness Index
The Common Sense Institute issues a Free Enterprise Report annually. The report assesses each state’s competitiveness relative to 49 other states and the District of Columbia, and it provides data and analysis on eight policy areas: education, energy, healthcare, housing, infrastructure, public safety, government budget, and taxes and fees. An increase (decrease) in an index indicates increased (decreased) competitiveness relative to the other 49 states and the District of Columbia. For example, if Iowa’s performance on a particular metric improves but other states improve by more, Iowa’s competitiveness rank relative to all states will decline.
To gauge how safe Iowa is relative to other states, CSI produces a State Public Safety Competitiveness Index for all 50 states and the District of Columbia consisting of five metrics that capture distinct aspects of public safety. The first three metrics measure outcomes; the last two measure inputs that may impact outcomes:
- crime rate,
- drug overdose deaths,
- homelessness,
- police per capita, and
- public safety spending per capita.
The index ranks Iowa relative to all fifty states and the District of Columbia by each metric. It then equally weights and sums each ranked metric, which it then ranks again to produce an aggregate measure of state public safety competitiveness as shown in figure 1. Iowa scored 76 in CSI’s Public Safety Competitiveness Index in 2011 and rose one spot to 77 by 2023, increasing its overall rank from 19th to 14th based on all five metrics. An increase in the Public Safety Competitiveness Index is a positive qualitative change—i.e., the state is more competitive as the index approaches one hundred.
Over the index period from 2011 through 2023, Iowa peaked with an overall Public Safety Competitiveness Index score of 78 in 2012. It never dropped below 74. While Iowa’s overall index score did not fluctuate much, its rank amongst all states and D.C. fluctuated between a high of 14th best to a low of 28th. When ranked based only on the three outcomes-based metrics, however, Iowa has remained in the top 3 states for public safety every year since 2011. Because Iowa ranks far better in the outcomes-based metrics than the inputs-based metrics, its overall score understates how safe it is relative to other states, as explained in more detail later in this report under the section “Iowa #1 in Public Safety Outcomes.”
From 2011 to 2023, Iowa’s index scores for each metric remained mostly flat, meaning its performance relative to other states saw little change for each metric. Only the “crime rate” metric decreased from the first to last year, falling from 88 in 2011 to 86 in 2023. Every other metric saw modest improvement over the period. The competitiveness index score for “drug overdose deaths per capita” rose from 94 in 2011 to 97 in 2023; “homelessness per capita” improved from 92 to 94; “police per capita” went from 54 to 59; and “public safety spending per capita” increased from 50 to 51.
All metrics except homelessness per capita experienced little volatility in their index scores in the intervening years between 2011 and 2023. Homelessness per capita experienced a 21-point fluctuation from peak to trough. The crime rate had a 7-point difference between its highest and lowest year’s score. The other metrics saw no more than a 4-point variance, remaining mostly flat in their performance relative to other states. Figure 2 shows the change in Iowa’s index scores for each metric over time.
A change in an index score does not necessarily signal an improvement or decline in its performance. Rather, it indicates a change in competitiveness relative to other states. The following sections of this report take a closer look at each of the five metrics employed to develop CSI’s Public Safety Competitiveness Index. They describe Iowa’s relative competitiveness based on an index score but also show its change in absolute performance. Comparing relative and absolute performance reveals whether a change in Iowa’s index score resulted from a change in its performance, other states’ performances, or possibly both.
Crime Rate – Competitiveness Index and Metric
Common Sense Institute developed the crime rate index based on a crime rate metric derived from FBI data. It sourced the data for 2011 through 2020 under the FBI’s previous data classification. Because the source does not provide data beyond 2020, the index assumes a continuation of 2020 crime rates through 2023. The FBI has switched to the National Incident-Based Reporting System (NIBRS); the next iteration of CSI’s Public Safety Competitiveness Index will utilize NIBRS.
Figure 3 charts the crime rate metric built from FBI data on the left axis with CSI’s crime rate competitiveness index score on the right axis. In 2011, the crime rate metric clocked in at 2585.9, falling to 2001.7 in 2020 (held constant through 2023 in CSI’s index). This 22.6% decline in the underlying metric resulted in Iowa falling by two points in the competitiveness index from 88 to 86. This indicates that while crime improved in Iowa over the period, there was significant improvement in other states also. That means Iowa saw less of an overall index score improvement than it would have seen had all other states’ crime rates remained constant.
Despite worsening in absolute terms and relative to other states, Iowa remains one of the safest states in the nation. An index score of 86 makes Iowa the 14th safest state in the nation by crime rate. This mirrors other reports, including usa.com whose state crime index puts Iowa at number 12 in the nation.[i]
Drug Overdose Deaths per Capita – Competitiveness Index and Metric
Common Sense Institute used data from the Center for Disease Control and Prevention (CDC) to determine drug overdose death rates for all 50 states and D.C. to build its drug overdose index. It relied on population data from the American Community Survey (ACS) to calculate overdose deaths per capita. While overdose deaths rose in Iowa between 2011 and 2023, they rose at a slower pace than other states.
Figure 4 charts Iowa’s drug overdose death rates per capita on the left axis against CSI’s drug overdose deaths metric index score on the right axis. Both the index and the underlying metric rose from 2011 to 2023. The underlying metric increased from 96 per million residents in 2011 to 142 in 2023—a 47.9% increase in the per-capita overdose death rate. Despite this increase, Iowa improved in its index ranking, rising from 94 in 2011 to 97 in 2023 and making Iowa the third best off in the nation according to the index.
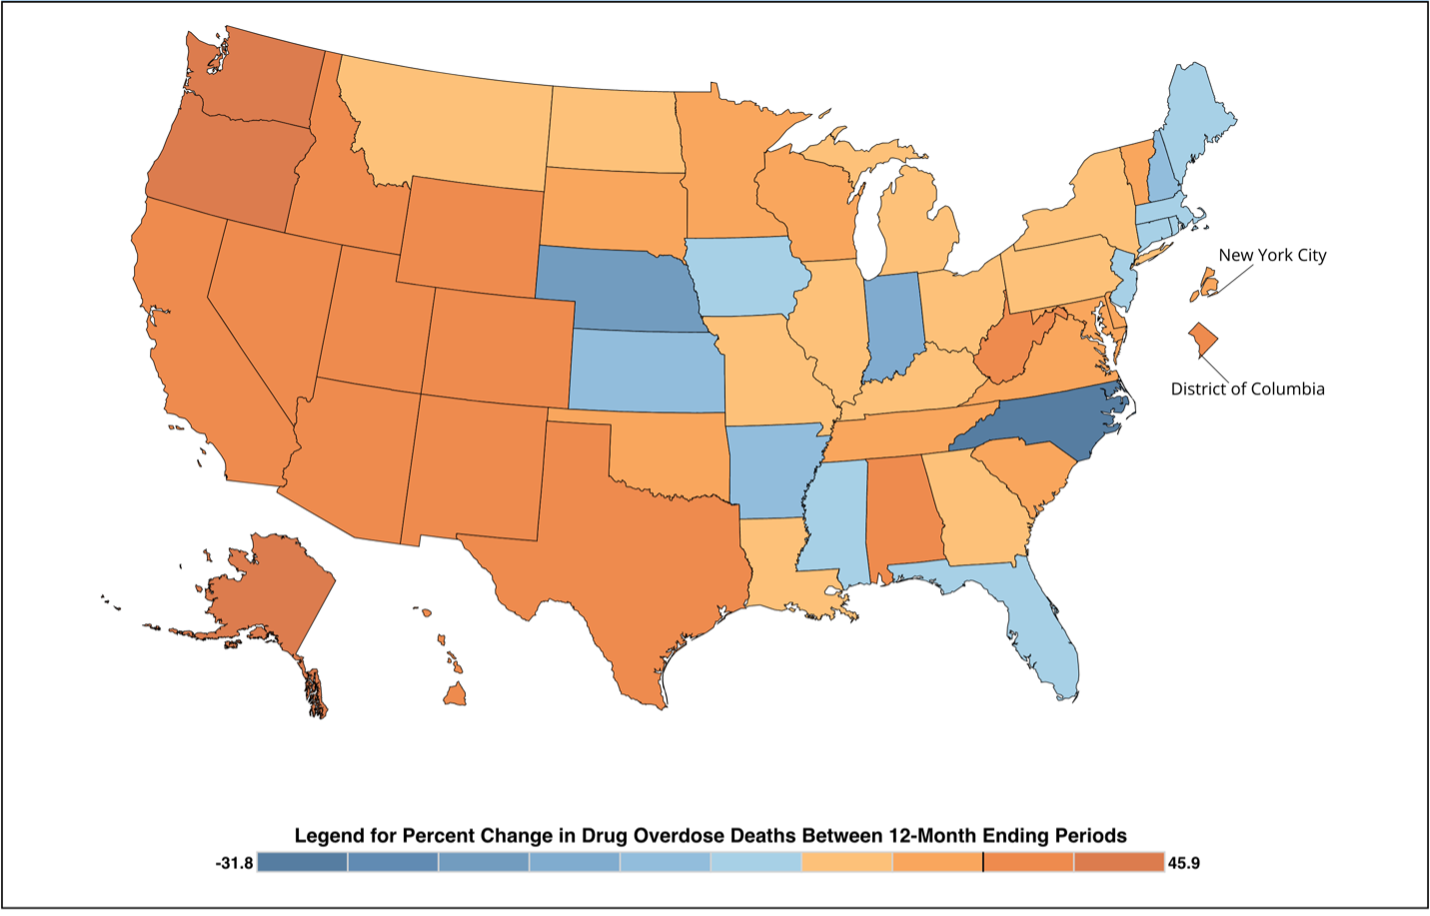
Notably, Iowa’s drug overdose rates per capita remained mostly flat from 2011 until the COVID-19 pandemic. From January 2019 through January 2022, drug overdose deaths rose by nearly 50%, according to CDC data (see figure 5).[ii] During that time, drug overdoses increased in Iowa as they did across the nation, but by a lesser amount, allowing Iowa to improve relative to other states. Furthermore, the state’s overdose rate decreased in 2023, while most states continued to increase, as seen in figure 6.
Figure 5. 12 Month-ending Provisional Counts of Drug Overdose Deaths: United States
Source: CDC
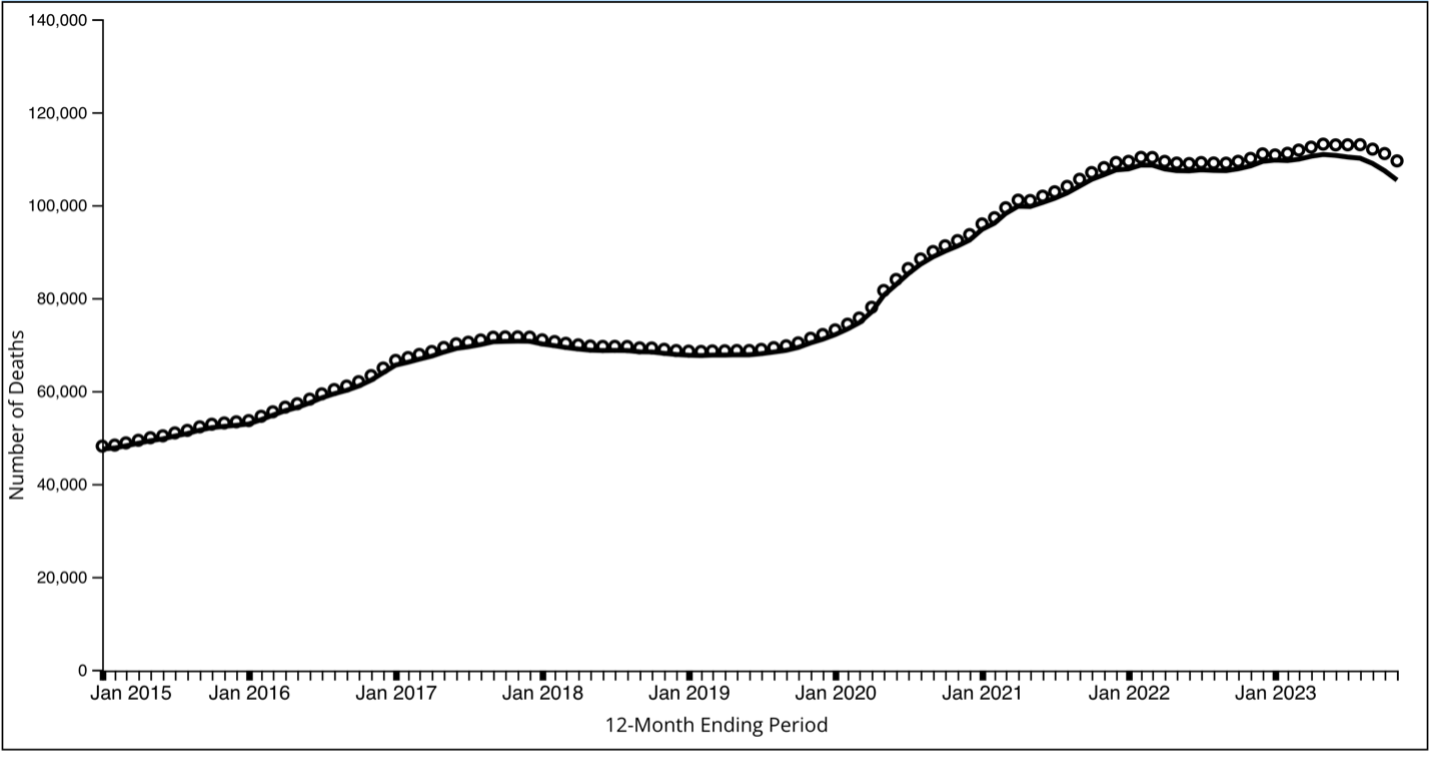
Figure 6. Percent Change in Reported 12 Month-ending Count of Drug Overdose Deaths: November 2022 to November 2023
Source: CDC
Homelessness Per Capita – Competitiveness Index and Metric
For the homelessness per capita index metric, Common Sense Institute determined the rate of homelessness per capita using Point in Time (PIT) data from the United States Department of Housing and Urban Development (HUD) and population data from ACS. With the rate of homelessness falling 25.5% from 2011 to 2023, Iowa competitiveness rose from an index score of 92 to a score of 94.
In 2011, Iowa had a rate of 1,020 homeless persons per one million residents. That dropped to a low point of 730 in 2019 before rising sharply to 830 when the PIT survey took place in January 2020, right before the pandemic. The homeless situation improved after the pandemic began, validating claims by HUD’s public affairs office in August 2023 that pandemic policies “averted” a surge in homelessness during the pandemic.[iii] In fact, homelessness across the nation began trending downward in 2012, according to the Associated Press.[iv] That trend held nationally through the pandemic, as stimulus and public policies helped keep Americans housed. However, the trend reversed as pandemic-era aid lapsed in 2022 and 2023, according to Jeff Olivet, executive director of the U.S. Interagency Council on Homelessness.[v] But Iowa bucked the trend. In January 2021, the PIT survey showed 790 homeless persons per one million residents. In 2022 and 2023, the number stayed stable at 760.
Common Sense Institute’s April 2024 Iowa Housing Competitiveness Index report may provide insight into why Iowa has not seen the surge in homeless over the last year or two that other states have seen and thus why it has improved on this metric relative to other states. Mr. Olivet cited the shortage of affordable homes and high cost of housing as the leading causes of the recent rise in homelessness across the United States.[vi] With a decline in homelessness per capita since 2021, Iowa seems to have largely dodged this cause and effect. According to CSI’s Housing Competitiveness Index, Iowa is the 9th cheapest state to rent and the 9th cheapest to buy a home relative to typical wages in the state.[vii] While housing costs have gone up across the country, Iowa’s relative affordability of housing appears to have helped its rate of homelessness to remain stable as other states saw it rise between 2022 and 2023. Figure 7 shows the rate of homelessness per capita in Iowa against the state’s index score for this metric.
Police Per Capita – Competitiveness Index and Metric
From 2011 to 2019, Iowa had 1.7 police officers per 1,000 residents. That number increased to 1.8 in 2020 and has remained the same since. Over the same period, however, its relative competitiveness for this metric has fluctuated significantly. In 2011, it scored 54 on the index before rising to 57 in 2013 and falling steadily to 53 in 2018. It rose steadily from 53 in 2018 to 59 in 2022. Figure 8 charts Iowa’s performance on the underlying metric—which remained mostly stable over the period—against its index score. It indicates the change in Iowa’s index score and its relative improvement over time is more a function of changes in other states than improvements within Iowa.
Public Safety Spending Per Capita – Competitiveness Index and Metric
Iowa spends less per capita on public safety than any other state except Arkansas and Kentucky. And while public spending per capita increased in Iowa in nominal terms between 2011 and 2023, it decreased in real dollars. From 2011 through 2023, consumer price inflation rose about 32% while per capita public safety spending rose only 26.2% from $460.71 to $581.60 per resident. Over that period, Iowa’s index score for this metric rose from 50 to 51 as Arkansas’s per capita spending increased at an even slower pace. However, this metric tells an entirely different story for these two states.
On all three of CSI’s outcomes-based Public Safety Competitiveness Index metrics, Iowa ranks among the top in the nation: third best for drug overdoses, sixth best for homelessness, and 14th best for crime. That Iowa maintains such impressive outcomes while spending relatively little public money to achieve them is laudable. Arkansas, in contrast, ranks 6th worst in the nation for crime while spending relatively little to solve the problem. Iowa’s positive public safety outcomes may have led state and local budgeters to have allocated public dollars to more pressing needs—and reasonably so. In other words, less government spending on public safety may be a positive indicator in Iowa’s case. In Arkansas, however, less government spending on public safety may be an indicator that state and local policymakers are not doing enough to address high crime rates.
Iowa #1 in Public Safety Outcomes
Common Sense Institute’s Public Safety Competitiveness Index does not accurately convey Iowa’s public safety competitiveness, because it equally weights the inputs-based metrics with the outcomes-based metrics. While this approach may make sense for states like Arkansas that have bad outcomes and ought to increase inputs to improve those outcomes, it is not well suited for states like Iowa that have good outcomes even with relatively low inputs.
In the CSI index, the first three metrics—crime rates, drug overdoses per capita, and homelessness per capita—measure outcomes related to a state’s performance on public safety. The last two metrics—police per capita and public safety spending per capita—measure inputs that if administered well could improve public safety outcomes. Iowa’s Public Safety Competitiveness Index score of 77 reflects high relative performance on the outcomes-based metrics and low relative performance on the inputs-based metrics. Based on the full index with all five metrics, Iowa ranks 14th most competitive for public safety in the nation. When factoring in only the three outcomes-based metrics, Iowa rises to number one.
Figure 10 shows Iowa’s Public Safety Competitiveness Index score compared with neighboring states according to the CSI index with all five metrics included versus its score with only the outcomes-based metrics included.
Consider Kansas. In the original CSI competitiveness index, Kansas scores 80 on the overall index compared with Iowa’s 76. Kansas has the eighth best score nationally; Iowa has the 14th best. The index’s component metrics show why. Despite underperforming Iowa on all three outcomes-based metrics, Kansas far outspends Iowa on public safety per capita and it ranks eighth in the nation for police per capita. Considering that Kansas ranks in the bottom half on crime rates, it makes sense that it would need more police officers. It also ranks in the bottom half for per capita spending on public safety, though still far higher than Iowa. In fact, based on its outcomes, the original 5-metric index implicitly highlights that Kansas could spend more on improving public safety outcomes. It rightly reduces Kansas’s score relative to most other states for its lack of spending on public safety while maintaining relatively high crime rates. But relative to Iowa, spending on public safety gives it an edge in the 5-metric index.
Illinois represents a similar case. It ranks below Iowa on drug overdose rates and crime rates. It ranks 97 versus Iowa’s 94 on homelessness per capita. Yet, in the 5-metric index, it ranks 87—ten points above Iowa. The state outperforms Iowa on CSI’s Public Safety Competitiveness Index because it spends far more per capita on public safety and has far more police per capita. Given its higher crime rates, this makes sense. However, that does not necessarily mean it outcompetes Iowa on public safety.
When indexing using only the three outcomes-based metrics, Iowa improves from an index score of 79 to a score of 92. Its national rank improves from 14th to number one. In contrast, Kansas falls to an index score of 79 from 80, and its rank falls to 16 from eight. Similarly, Illinois slips from 87 to 85 and goes from number one to number six.
Iowa, Nebraska, and South Dakota all perform better on the outcomes-based metrics while maintaining fewer police officers per capita and spending less on public safety per capita. This causes their index scores to suffer despite relatively good outcomes. Each of these states and Minnesota score better on an index based only on outcomes than on CSI’s five-metric Public Safety Competitiveness Index. Conversely, states like Kansas, Illinois, and Missouri have relatively poor outcomes, but score better than perhaps they should because they spend more money on public safety and deploy larger police forces. Each of these states and Wisconsin all score worse when considering only outcomes.
Any single index category—such as “Public Safety Competitiveness” for the CSI index or “Crime and Corrections” for the U.S. News & World Report index—provides limited information. A reader must look more closely into the component metrics to extract specific information. For example, to determine whether starting a business or raising a family in a state would be safer or more dangerous relative to other states, one might look at only a few metrics related to crime rates and other specific outcomes. The same holds for other state ranking indexes. U.S. News & World Report ranked Iowa the sixth-best state in the United States based on an index that ranks all 50 states using 71 metrics across eight categories.[viii] It ranks Iowa 14th best for its “Crime and Corrections” category.[ix] However, Iowa ranks 10th best for “public safety,” the component within the Crime and Corrections category that measures crime outcomes.[x] Similarly, Iowa ranks just 14th in the Public Safety Competitiveness category of CSI’s Free Enterprise Competitiveness Index, but in outcomes closely correlated with criminality, Iowa ranks number one.
Indexes like CSI’s Public Safety Competitiveness Index and the U.S. News & World Report index provide a snapshot of the current situation in Iowa relative to other states, but they do not explain the reason behind the data. Common Sense Institute’s index uncovers correlations that may point to possible causation, but it leaves many questions unanswered. For example, Iowa spends less on public safety than other states and yet maintains relatively good public safety outcomes. Are the lower spending levels simply a consequence of low crime, or does Iowa benefit more than other states from federal law enforcement spending? Interstate 80 sees a high volume of drug trafficking, which brings federal law enforcement to the state.[xi] Perhaps Iowa spends less because it relies on federal law enforcement to a larger extent than other states. In addition, Iowa has no metropolitan area with over one million residents. Could this have an impact on the outcomes versus inputs metrics? These and other questions the index raises could provide a basis for additional researc
Bottom Line
Over the last decade, Iowa has maintained low crime rates, low homelessness rates, and low overdose death rates while expending relatively few public resources to achieve these outcomes. Based on outcomes in three key areas, Iowa is the most competitive state in the nation for public safety and has remained in the top three for over a decade. Until crime, homelessness, and overdose rates reach zero, the state always has room for improvement. Increasing the number of police or spending more on public safety may improve results if the new resources are deployed prudently. In terms of competitiveness relative to other states, however, Iowa remains one of the most if not the most attractive place in the nation to live and work if public safety is a top concern.
[i] USA.com, “U.S. Crime Index State Rank,” http://www.usa.com/rank/us–crime-index–state-rank.htm (accessed May 11, 2024).
[ii] U.S. Centers for Disease Control and Prevention, National Center for Health Statistics, “Provisional Drug Overdose Death Counts,” National Vital Statistics System, https://www.cdc.gov/nchs/nvss/vsrr/drug-overdose-data.htm (accessed May 11, 2024).
[iii] U.S. Department of Housing and Urban Development, “Data Reports Show that Surge in Homelessness Was Averted During COVID-19 National Emergency: Two New HUD reports suggest that federal relief prevented a rise in evictions and homelessness during the pandemic,” Press Release, August 22, 2023,
https://www.hud.gov/press/press_releases_media_advisories/hud_no_23_178 (accessed May 12, 2024).
[iv] Kevin Freking, “US homelessness up 12% to highest reported level as rents soar and coronavirus pandemic aid lapses,” Associated Press, December 15, 2023, https://apnews.com/article/homelessness-increase-rent-hud-covid-60bd88687e1aef1b02d25425798bd3b1 (accessed May 12, 2024).
[v] Freking, https://apnews.com/article/homelessness-increase-rent-hud-covid-60bd88687e1aef1b02d25425798bd3b1.
[vi] Freking, https://apnews.com/article/homelessness-increase-rent-hud-covid-60bd88687e1aef1b02d25425798bd3b1.
[vii] Steven L. Byers, Ben Murrey, and Peter LiFari, Iowa Housing Competitiveness Index, (Des Moines: Common Sense Institute, April 2024), https://commonsenseinstituteia.org/iowa-housing-competitiveness-index/.
[viii] U.S. News & World Report, under “Best States” and “Iowa,” https://www.usnews.com/news/best-states/iowa (accessed May 9, 2024).
[ix] U.S. News & World Report, under “Best States” and “Crime & Corrections,” https://www.usnews.com/news/best-states/rankings/crime-and-corrections (accessed May 9, 2024).
[x] U.S. News & World Report, under “Best States” and “Methodology,” https://www.usnews.com/news/best-states/articles/methodology (accessed May 9, 2024).
[xi] Natasha Keicher, “11 people charged in federal firearms, drug investigation,” WHO13 News, https://who13.com/news/11-people-charged-in-federal-firearms-drug-investigation/ (accessed May 20, 2024).